
Chart patterns reflect the reality.
The patterns forming on the price chart of a stock reflect the reality of a stock. These are often overlooked by most investors and analysts alike, but the charts show a reliable study of where the prices are heading towards from the current state. In long term, the charts reflect the reality of the company’s performance.
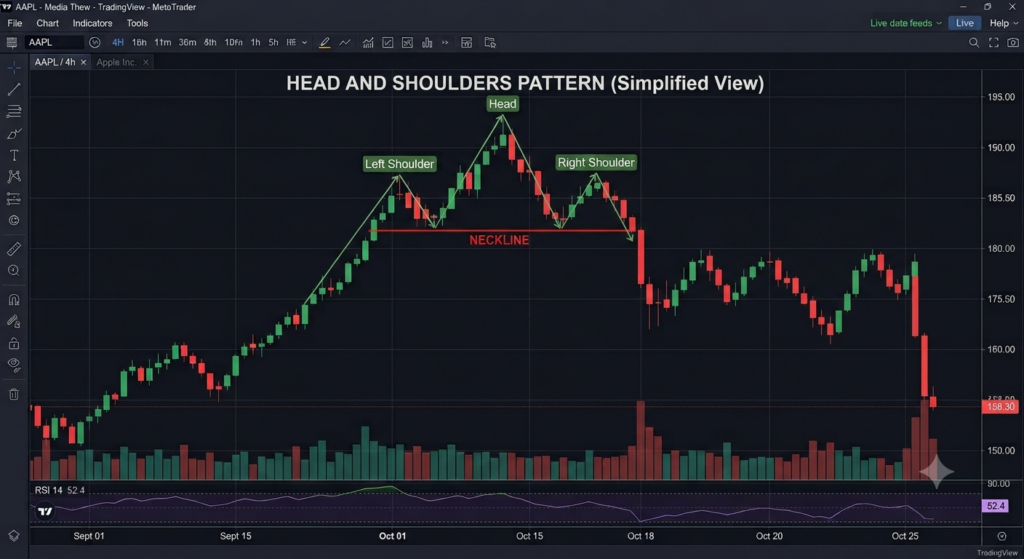
Head And Shoulders : reversal
In a long term chart, the Head and Shoulders pattern may sometimes take upto a few years to completely form. But the pattern in an uptrend reflects that the company might be performing average in terms of revenue or the balance sheet might be loosing its charm or that competition might be hitting hard etc. Conclusively, it means that the performance has been average over this time or it is expected to be average for future.
In a Downtrend, the pattern reflects that the company’s financial health and performance is improving steadily or is expected to improve in the times to come.
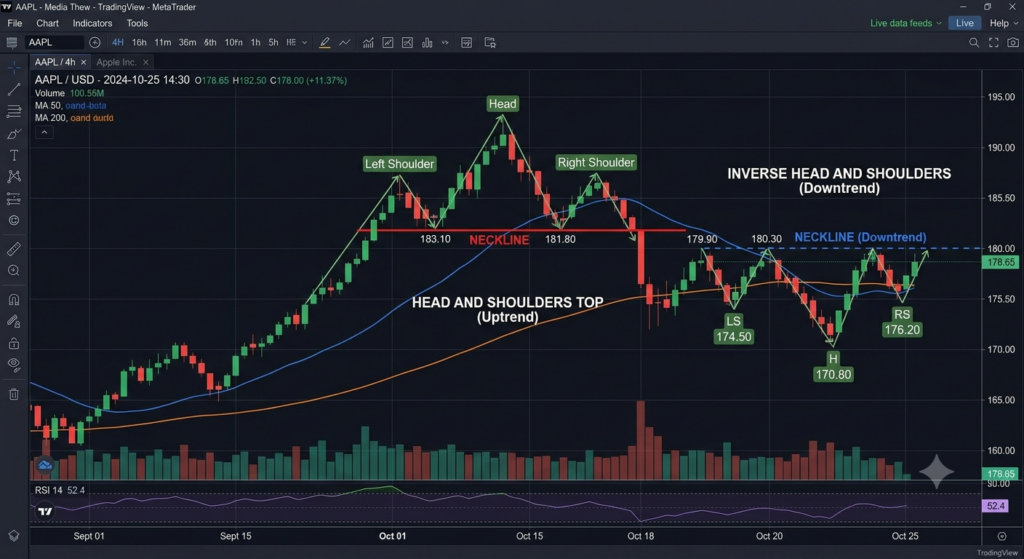
Breaking of the neckline : Pattern confirm
Before taking your position, it is important that the investor has patience and wait for a confirmation signal from the chart, apart from performing fundamental analysis. The chart pattern in confirmed when the neckline is broken at the end of the pattern and the prices move forward below or above the neckline. If the prices fail to move down(further from the top of an uptrend) or move up (further from the bottom of a downtrend) then the reversal might just not happen and the uptrend or downtrend might continue.